Any image that you reproduce in your paper--along with artworks, charts, infographics, and anything that doesn't qualify as a Table--are called "Figures" in APA Style. Figures are introduced by a number and title, with explanatory notes and citations (if needed) directly below the figure.
Tables are not the same as figures. They have strict formatting guidelines and are used to streamline the presentation of large amounts of raw data. If it would be cumbersome to write out so many number results in the text, a table will likely clarify the information for the reader.
APA Table Basic Format:
Table 1
Table Title Goes Here
Scale 1 2 3 4 5
Row category ## ## ## ## ##
Row category ## ## ## ## ##
Row category ## ## ## ## ##
Row category ## ## ## ## ##
Row category ## ## ## ## ##
Row category ## ## ## ## ##
Note. Explanatory notes can go here, followed by a full source citation. Use "From" if you took the table in its entirety, and "Adapted from" if you created a table from someone else's data. Do not use any vertical lines--only horizontal lines around the header row and at the bottom. This is a simple example--consult the manual for complex table construction.
APA Sample Table:
Table 2
Results of Curve-Fitting Analysis Examining the Time Course of Fixations to the Target
|
Logistic parameter |
9-year-olds |
16-year-olds |
t(40) |
p |
Cohen's d | ||
| M | SD | M | SD | ||||
| Maximum asymptote, proportion | .843 | .135 | .877 | .082 | 0.951 | .347 | 0.302 |
| Crossover, in ms | 759 | 87 | 694 | 42 | 2.877 | .006 | 0.840 |
| Slope, as change in proportion per ms |
.001 | .0002 | .002 | .0002 | 2.635 | .012 | 2.078 |
Note. For each subject, the logistic function was fit to target fixations separately. The maximum asymptote is the asymptotic degree of looking at the end of the time course of fixations. The crossover point is the point in time the function crosses the midway point between peak and baseline. The slope represents the rate of change in the function measured at the crossover. Mean parameter values for each of the analyses are shown for the 9-year-olds (n = 24) and 16-year-olds (n = 18), as well as the results of t tests (assuming unequal variance) comparing the parameter estimates between the two ages.
APA Sample Table (Annotated):

APA Figure Basic Format:
Figure 1
Figure Title Goes Here
![]()

Note. Explanatory notes can go here, followed by a full source citation. This example is a chart, but could be an image or any visual which doesn't qualify as a table. Do not use images to which you are not the copyright holder without first obtaining permission. If you create a chart using data from a source, indicate this in your note and citation.
APA Sample Figure:
Figure 2
Poverty Rate in the United States, 2017
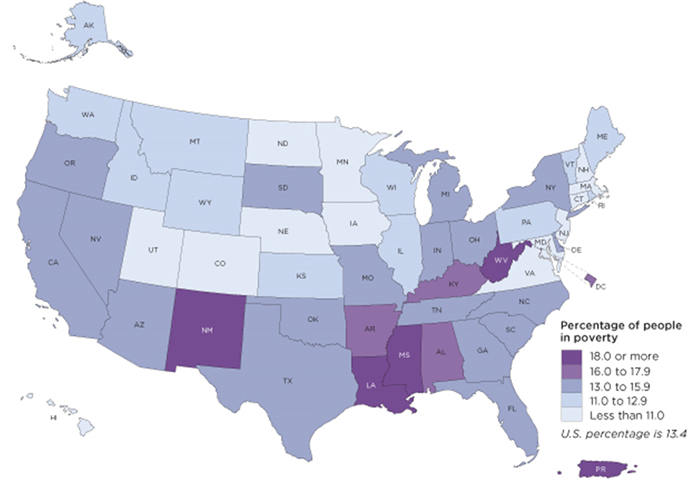
Note. The map does not include data for Puerto Rico. Adapted from 2017 Poverty Rate in the United States, by U.S. Census Bureau, 2017 (https://www.census.gov/library/visualizations/2018/comm/acs-poverty-map.html). In the public domain.
APA Sample Figure (Annotated):
